Sunday, June 7, 2015

RC and LRC Circuits


We first created a relationship with impedance and current. We find that we can sub in our angular velocity times capacity for impedance. We were then asked what would happen if frequency was doubled. We were able to find that our current would double as a result.


The graphs above were generated by circuit with a frequency generator, resistor, and capacitor. The voltage and current were measured at a 10 Hz frequency.


The above two graphs were measured with a 1 kHz frequency and since the logger has a bit of internal lag, we had to measure current and electric potential separately. 


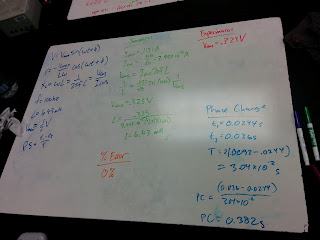
In this picture we created a table of values for each of the frequencies that we tested. Most values were given by either our setup or the graphs. We first had to calculate our capacitive reactance so we could solve for our theoretical impedance. We then calculated the impedance Z from a Vmax and Imax from the graphs, and afterward we found that there was a huge discrepancy between our impedances. This was most likely due to the unknown resistance of the frequency generator. On the bottom we calculated our phase changes between the two graphs of voltage vs time and current vs. time. 


The picture above illustrates resonance frequency. This is what occurs when the capacitive reactance and the inductive reactance are equal.


In the picture above we solve for power dissipated. The power dissipation relies solely on the resistor in this case.


We repeated the experiment, but this time with an inductor attached as well. The graph shown above was actually our output.


Monday, June 1, 2015

Alternating Current


In this picture we solved for the given integral and we also wrote formulas for the Root Mean Squared values of Voltage and Current. We also wrote a formula for average Power.


This was our setup for an experiment where we calculated I_rms and V_rms. We connected the frequency generator a current reader and voltage meter, which was hooked up to a logger pro, to a board (we used the resistor side first with a 100 Ohm resistor) and we ran the experiment.


In the above two pictures we first calculated our experimental values, then we ran the experiment to find our experimental values. We were extremely close in our V_rms values and our experimental value for I_rms was only 9.7% off. We also see that the relationship between current and electric potential is linear.


In the above picture we were able to create some relations with the capacitor reactance, root mean squared Voltage and Current, and the angular velocity/frequency. With these we were able to solve for a given situation in class.


In the above experiment we repeated our same experiment as above but we used a capacitor instead. In this situation we compared our graph, theoretical, and experimental values. We also calculated a phase change. The graph of potential vs. current shows a circle, which means that the current was a cos graph and the potential was a sin graph.


In this picture we show what we had confirmed in the graphs above, electric potential is a sign graph and current is a cos graph. On the right side of the board we found the I_rms and the capacitor reactance with a given V_rms, inductance and frequency.


In the pictures above we repeated our earlier experiments but used a 440 turn inductor instead of a resistor or capacitor. We had an issue using the inductance we had found in a prior lab so we had to solve for the inductance here as well.

RL Circuits


In the above picture we first found the color coding on a 100 Ohm resistor, which was brown-black-brown. On the right side of the board we found the resistance of an 18 gauge copper resistor which we did by first density, finding the area, then finding the length of the coil (by multiplying it by its length on one side, turns, and number of sides). We were then able to plug and chug with the Resistance formula. We then were given the measurements of an inductor and with that we were able to find its inductance. With the inductance and the resistance (150 Ohms, 50 from the frequency generator and 100 from the resistor) we were able to find our time constant. 


In this picture we ran an experiment with a given inductor, which had 440 turns of coil. We calculated lengths, area, resistance and inductance theoretically before running the experiment. We then ran 5 volts with a square graph to come up with the graph shown on the oscilloscope. With this we were able to calculate our experimental values for our time constant, inductance, and number of turns. With these values we were also able to calculate the uncertainties with our experiment and the theoretical values we originally calculated.


In this picture we examined Faraday's Law of inductance. We also have the formula for it on the right top corner of the board. We were then given a circuit composed of a power source, 2 resistors and 1 inductor. We first calculated our max currents and then found the current at a specific time (170 ms). At this point we had calculated our time constant by dividing the inductance by the resistance of the circuit. With the time, time constant, and max current we were able to find currents at specific times. We also found the time it would take for there to be 11 volts in the inductor.

Wednesday, May 20, 2015

Electromagnet Induction


We did an active physics activity to start the class. In this activity we showed the relationship between flux and EMF.


In the above pictures Professor Mason showed what would happen to a rod when a current is run through it and it has a magnetic field going upward. In the first picture the the current is going away from me so the rod is pushed away from the magnet. In the second picture the current is coming toward me so the rod is pulled toward the magnet. We can figure out these directions by using our right hand rule.


Afterward we did another activity in active physics. In this one we examined the connection between current, EMF, and Magnetic Flux. We can see that flux depends on area so if area increases or decreases so does flux.


On the left side of the board we derived relationships between induced current and induced voltage. We also came up with relations between capacity and current and electric potential. On the right corner we derived the unit for inductors. In the center of the board we solved for inductance of a rod with a given radius, length, and number of turns of coil around it. 


This was another activity we did from active physics. In this activity we examined a RL circuit (circuit containing a resistor and an inductor). 


In the above picture we examine the graphs of current vs. time and voltage vs. time when there is an inductor.


Sunday, May 17, 2015

Force due to Magnetic Fields and Currents


In the pictures above Professor Mason used a Halls Effect Sensor to determine the magnetic field in the classroom. He spun it around and from the graph we can see that it was strongest in the initial direction he was pointing it, then it slowly dropped until he bottomed out, which was the opposite direction he started at, and then it slowly rose to its max when it was going back to it's initial direction.


This was our experimental graph. We used the Hall Effect Sensor to determine the magnetic field due to copper wires around a test tube. Our readings were a tad low over the course of our experiment due to the Hall Effect Sensor being pointed slightly in the wrong direction. This wasn't noticed by us until our last reading, which was much lower than the previous reading. After correcting the direction we got a much larger reading for our final run.


In this picture was can see that when two currents (through wire) are next to each other and in the same direction, force vectors which oppose each other are created. The graph on the bottom shows that the magnetic field takes the shape of a sinusoidal graph.


In the above 3 pictures Professor Mason showed us that the magnetic field created by a current through loops was much higher when there were many more loops of wire. Also the speed at which the magnet was moved in or out effected the strength of the field.


In the device above a current is run through the copper wires on the bottom of the device, which creates a magnetic field in an upward direction. In the upper portion of the device an opposing field and current is created as a result. 


In the above two pictures Professor Mason showed that the current created by the bottom portion of the device was able to light the bulb connected to this wooden ring. At a greater distance the light was lowered showing that the current was much stronger when it was closer to the copper wires.


In the above two pictures we can see the opposing magnetic fields in action. The first picture shows copper and the lower picture shows the aluminum. The aluminum is more susceptible to the field and as you can see it was blown off the device with the same amount of current that barely lifted the copper.


Steel was also lifted.


We can see in the above picture that a slight gap in the ring would stop a magnetic field from being created.


We can see in the above picture that if we have a longer solenoid, larger magnet, increased radius of solenoid, or if we increase the velocity of the magnet that we can increase the magnetic field created.


In the above two pictures, Professor Mason showed what would happen if a magnetic object was dropped through an aluminum cylinder. The magnet falling through the aluminum cylinder creates a current in a counterclockwise direction which creates magnetic force in an upward direction which causes it to fall much slower.


In the above picture we show what an emf graph would look like compared to the magnetic field graph over time.

Magnetic Fields Due to Currents


Professor Mason showed that when a magnetized metal is heated it will lose it's magnetism. This is due to the fact that when an object is heated its molecules speed up, causing the dipoles to also move out of their magnetized orientation.

Here we showed that when you magnetize a metal you are simply causing all of its poles to point in one direction, which gives it an attraction. We also figured that to destroy a magnet you would either need to get it hot in order to cause the all of it's molecules to move at a high rate or hit it really hard with something like a hammer. We also determined how to solve for the electric dipole moment.


Here we were able to get these wire loops to spin by running a current from the batteries through the wires. The magnet below created a force vector which cause the wire to spin upwards. The momentum of the spin would keep the wires spinning when it was completely parallel to the magnet and then as soon as there was any angle between the area vector and the magnetic field the process would repeat.


We talked a bit about the tiny motors that run various little devices. The first things to likely break are the Commutator and the brushes. We also talked about how the current direction could affect the rotation of the motor.


In the above 3 pictures Professor Mason ran a current through a pole surround by compasses. The compasses would react based on the direction of the current. The magnetic field would go in a counterclockwise direction and when the current was reversed the field went in a clockwise direction.


In the top two pictures Professor Mason ran a current through the wires and he used a 3 dimensional compass to show which way the field would point at various locations on the setup.


This board picture showed which direction the magnetic fields would go in the board setup and the compass setup. We also derived equations to determine the magnetic field, and the comparison between a magnetic field and an electric field.