In this picture we solved for the given integral and we also wrote formulas for the Root Mean Squared values of Voltage and Current. We also wrote a formula for average Power.
This was our setup for an experiment where we calculated I_rms and V_rms. We connected the frequency generator a current reader and voltage meter, which was hooked up to a logger pro, to a board (we used the resistor side first with a 100 Ohm resistor) and we ran the experiment.
In the above two pictures we first calculated our experimental values, then we ran the experiment to find our experimental values. We were extremely close in our V_rms values and our experimental value for I_rms was only 9.7% off. We also see that the relationship between current and electric potential is linear.
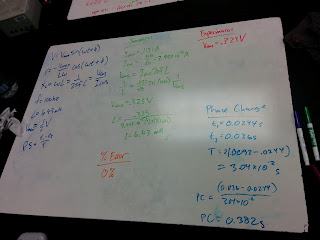
In the above picture we were able to create some relations with the capacitor reactance, root mean squared Voltage and Current, and the angular velocity/frequency. With these we were able to solve for a given situation in class.
In the above experiment we repeated our same experiment as above but we used a capacitor instead. In this situation we compared our graph, theoretical, and experimental values. We also calculated a phase change. The graph of potential vs. current shows a circle, which means that the current was a cos graph and the potential was a sin graph.
In this picture we show what we had confirmed in the graphs above, electric potential is a sign graph and current is a cos graph. On the right side of the board we found the I_rms and the capacitor reactance with a given V_rms, inductance and frequency.
In the pictures above we repeated our earlier experiments but used a 440 turn inductor instead of a resistor or capacitor. We had an issue using the inductance we had found in a prior lab so we had to solve for the inductance here as well.


No comments:
Post a Comment