Sunday, June 7, 2015

RC and LRC Circuits


We first created a relationship with impedance and current. We find that we can sub in our angular velocity times capacity for impedance. We were then asked what would happen if frequency was doubled. We were able to find that our current would double as a result.


The graphs above were generated by circuit with a frequency generator, resistor, and capacitor. The voltage and current were measured at a 10 Hz frequency.


The above two graphs were measured with a 1 kHz frequency and since the logger has a bit of internal lag, we had to measure current and electric potential separately. 


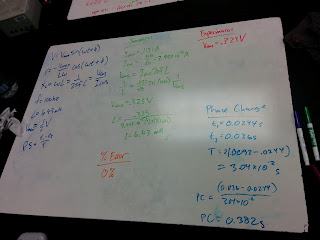
In this picture we created a table of values for each of the frequencies that we tested. Most values were given by either our setup or the graphs. We first had to calculate our capacitive reactance so we could solve for our theoretical impedance. We then calculated the impedance Z from a Vmax and Imax from the graphs, and afterward we found that there was a huge discrepancy between our impedances. This was most likely due to the unknown resistance of the frequency generator. On the bottom we calculated our phase changes between the two graphs of voltage vs time and current vs. time. 


The picture above illustrates resonance frequency. This is what occurs when the capacitive reactance and the inductive reactance are equal.


In the picture above we solve for power dissipated. The power dissipation relies solely on the resistor in this case.


We repeated the experiment, but this time with an inductor attached as well. The graph shown above was actually our output.


Monday, June 1, 2015

Alternating Current


In this picture we solved for the given integral and we also wrote formulas for the Root Mean Squared values of Voltage and Current. We also wrote a formula for average Power.


This was our setup for an experiment where we calculated I_rms and V_rms. We connected the frequency generator a current reader and voltage meter, which was hooked up to a logger pro, to a board (we used the resistor side first with a 100 Ohm resistor) and we ran the experiment.


In the above two pictures we first calculated our experimental values, then we ran the experiment to find our experimental values. We were extremely close in our V_rms values and our experimental value for I_rms was only 9.7% off. We also see that the relationship between current and electric potential is linear.


In the above picture we were able to create some relations with the capacitor reactance, root mean squared Voltage and Current, and the angular velocity/frequency. With these we were able to solve for a given situation in class.


In the above experiment we repeated our same experiment as above but we used a capacitor instead. In this situation we compared our graph, theoretical, and experimental values. We also calculated a phase change. The graph of potential vs. current shows a circle, which means that the current was a cos graph and the potential was a sin graph.


In this picture we show what we had confirmed in the graphs above, electric potential is a sign graph and current is a cos graph. On the right side of the board we found the I_rms and the capacitor reactance with a given V_rms, inductance and frequency.


In the pictures above we repeated our earlier experiments but used a 440 turn inductor instead of a resistor or capacitor. We had an issue using the inductance we had found in a prior lab so we had to solve for the inductance here as well.

RL Circuits


In the above picture we first found the color coding on a 100 Ohm resistor, which was brown-black-brown. On the right side of the board we found the resistance of an 18 gauge copper resistor which we did by first density, finding the area, then finding the length of the coil (by multiplying it by its length on one side, turns, and number of sides). We were then able to plug and chug with the Resistance formula. We then were given the measurements of an inductor and with that we were able to find its inductance. With the inductance and the resistance (150 Ohms, 50 from the frequency generator and 100 from the resistor) we were able to find our time constant. 


In this picture we ran an experiment with a given inductor, which had 440 turns of coil. We calculated lengths, area, resistance and inductance theoretically before running the experiment. We then ran 5 volts with a square graph to come up with the graph shown on the oscilloscope. With this we were able to calculate our experimental values for our time constant, inductance, and number of turns. With these values we were also able to calculate the uncertainties with our experiment and the theoretical values we originally calculated.


In this picture we examined Faraday's Law of inductance. We also have the formula for it on the right top corner of the board. We were then given a circuit composed of a power source, 2 resistors and 1 inductor. We first calculated our max currents and then found the current at a specific time (170 ms). At this point we had calculated our time constant by dividing the inductance by the resistance of the circuit. With the time, time constant, and max current we were able to find currents at specific times. We also found the time it would take for there to be 11 volts in the inductor.